Project Overview
The Monte Carlo Simulation project is a robust stochastic modeling tool designed to quantify financial risk and uncertainty. Unlike traditional linear forecasting, which assumes a constant growth rate, this application acknowledges the inherent randomness of markets. By simulating thousands of potential future price paths using Geometric Brownian Motion (GBM), it provides investors with a probabilistic distribution of outcomes, enabling more informed decision-making regarding portfolio allocation and risk management.
Problem Statement
Predicting stock market returns is notoriously difficult due to volatility and "black swan" events. Deterministic models often fail because they ignore the variance in daily returns. Investors needed a way to answer questions like: "What is the probability that my portfolio will drop below $10,000 in the next year?" or "What is the Value at Risk (VaR) at a 95% confidence interval?" This tool answers those questions.
Strategy / Model Definition
The core of this simulation is Geometric Brownian Motion (GBM), a mathematical
model for the path of an asset.
The model is defined by two main components:
1. Drift: The longer-term secular trend of the asset, derived from its average
historical return.
2. Shock (Volatility): The random component, representing daily market
fluctuations, derived from standard deviation.
Mathematically, the future price is calculated as:
P_t = P_{t-1} * e^((mu - 0.5 * sigma^2) * dt + sigma * epsilon * sqrt(dt))
Where mu is expected return, sigma is volatility, and epsilon is a random
variable following a normal distribution.
Methodology
The simulation process involves:
- Fetching real-time historical data from financial APIs.
- Calculating historical volatility and drift parameters.
- Running thousands of iterations to generate potential price paths.
- Visualizing these paths to understand the spread of outcomes.
Metrics & Evaluation Criteria
The simulation evaluates Value at Risk (VaR), Expected Returns, and the probability distribution of final stock prices after the simulation period.
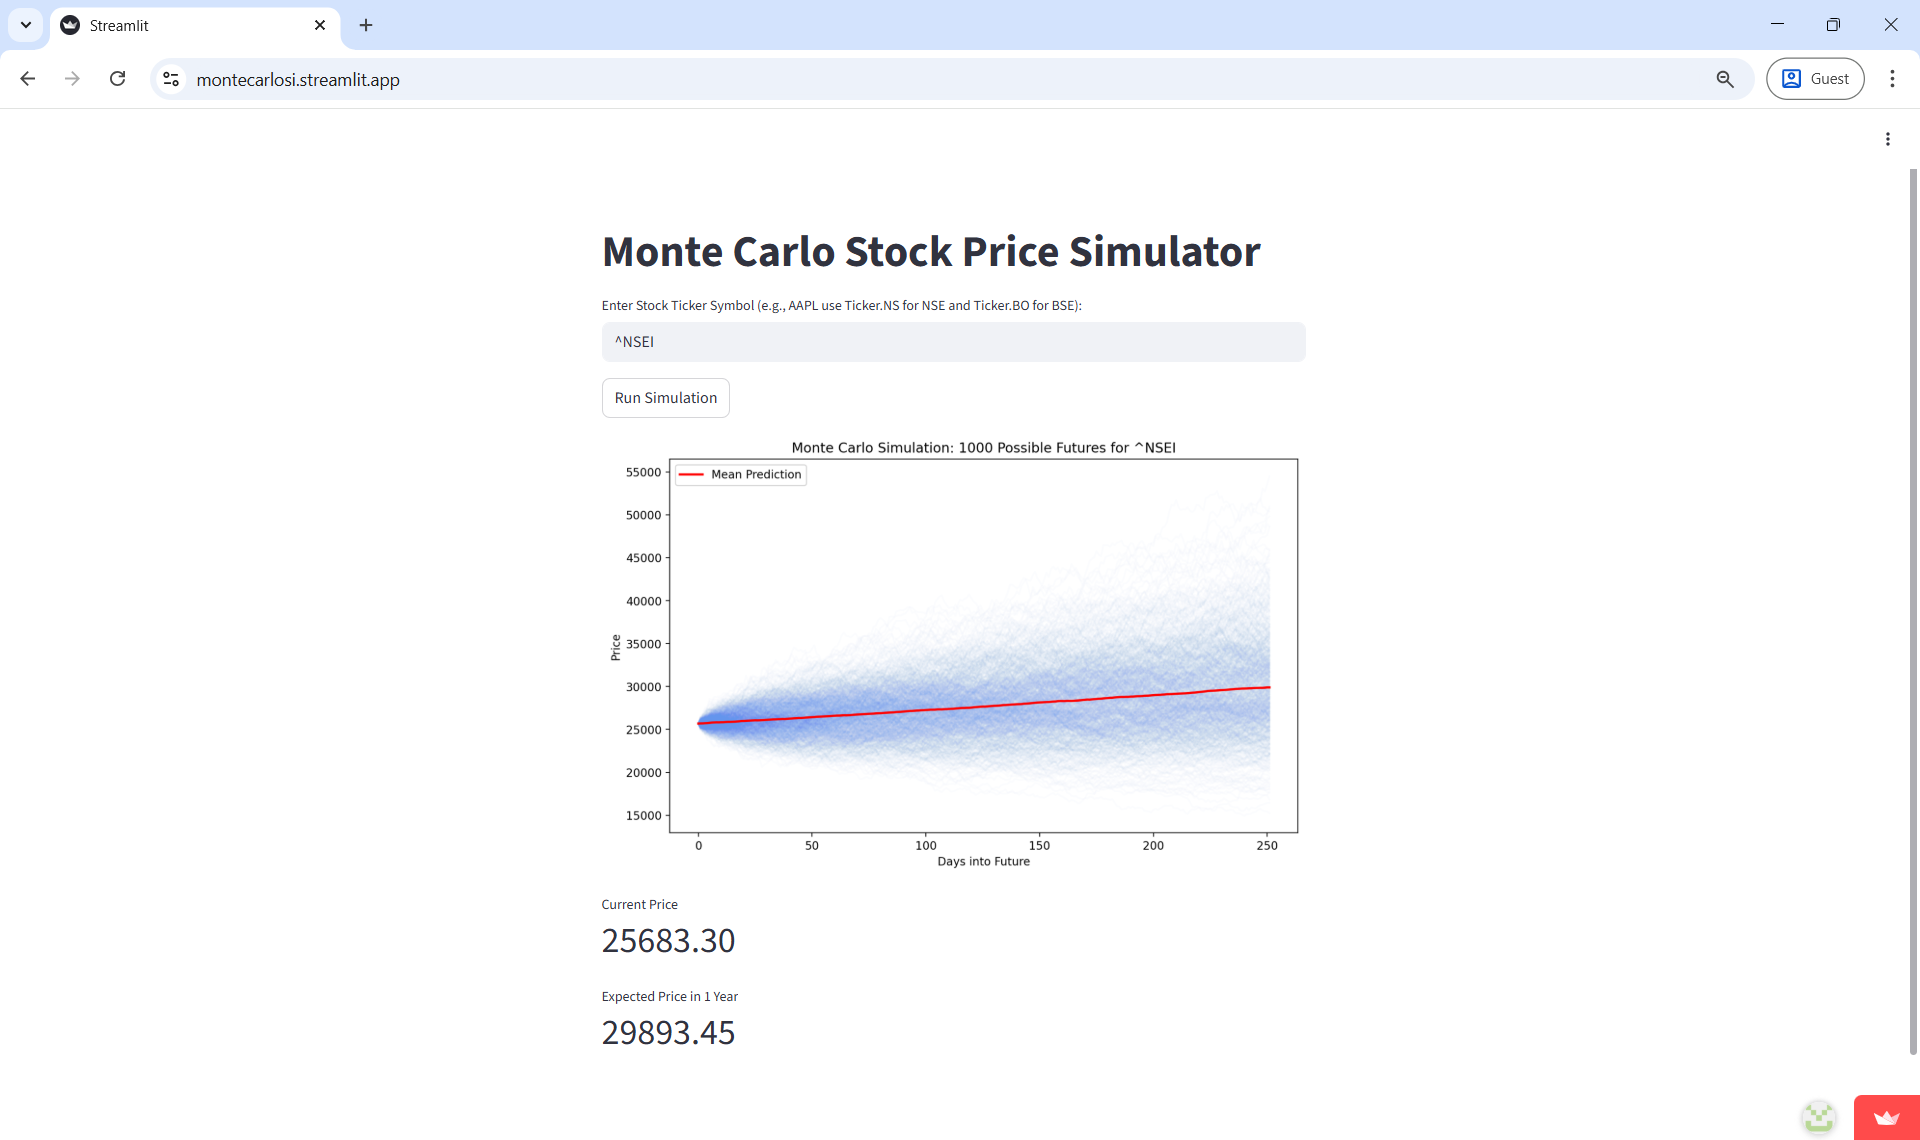
Results & Observations
The simulation typically results in a "Cone of Uncertainty" that widens as time progresses, visually demonstrating that long-term predictions carry more risk than short-term ones. For a stable blue-chip stock like Johnson & Johnson (JNJ), the cone remains relatively narrow. However, for high-beta stocks like Tesla (TSLA), the dispersion of possible outcomes is massive. The model successfully identifies the Value at Risk (VaR), showing that, for example, there is a 5% chance the asset could lose more than 20% of its value, which is critical for hedging strategies.
Interpretation & Limitations
While GBM is a standard model, it assumes constant volatility and log-normal distribution of returns, which may not always hold true in extreme market conditions (fat tails).
Project Artifacts
Key Takeaways
This project reinforced the concept that risk is not just a number, but a distribution. It highlighted the limitations of using historical data to predict the future (past performance does not guarantee future results), but also demonstrated the immense value of stress-testing portfolios against thousands of "what-if" scenarios rather than relying on a single "best-guess" forecast.